


Metabase is an open-source business intelligence and data visualization platform that makes it easy to turn your data into insights. By connecting Metabase to your Neon Postgres database, you can build interactive dashboards, explore your data, and share findings with your team without writing SQL.
This guide will walk you through the steps to set up Metabase with Neon. You'll learn how to:
- Connect Metabase to your Neon database
- Load a sample dataset for analytics
- Build interactive dashboards and visualizations
- Apply governance controls using collections and data permissions
- Scale your analytics with Neon connection pooling and read replicas
By the end of this guide, you'll have a fully functional Metabase setup connected to Neon, ready for exploring and analyzing your data.
Prerequisites
To follow along with this guide, you'll need the following:
- Neon account and project: A Neon account with a project containing a running Postgres database. You can create one at pg.new.
- Metabase instance: You can use Metabase Cloud, run Metabase locally via Docker, or deploy to your preferred hosting platform. This guide covers both Metabase Cloud and local Docker setups.
Latency Considerations
For optimal performance, ensure that your Metabase instance is hosted in the same region as your Neon database to minimize latency.
Connecting Metabase to Neon
Option 1: Metabase Cloud
If you're using Metabase Cloud, follow these steps to connect to your Neon database:
-
Create a Metabase Cloud account and complete the initial setup.
-
Add a database:
- During the setup wizard, you'll be prompted to connect a database.
- If your Metabase Cloud instance is already running, go to Settings > Admin > Databases and click Add database.
-
Enter your Neon connection details:
-
Choose PostgreSQL as the database type.
-
Paste the connection string from the Neon Console (Connection tab). It should look like:
postgresql://alex:AbC123dEf@ep-cool-darkness-123456-pooler.us-east-2.aws.neon.tech/dbname?sslmode=require&channel_binding=require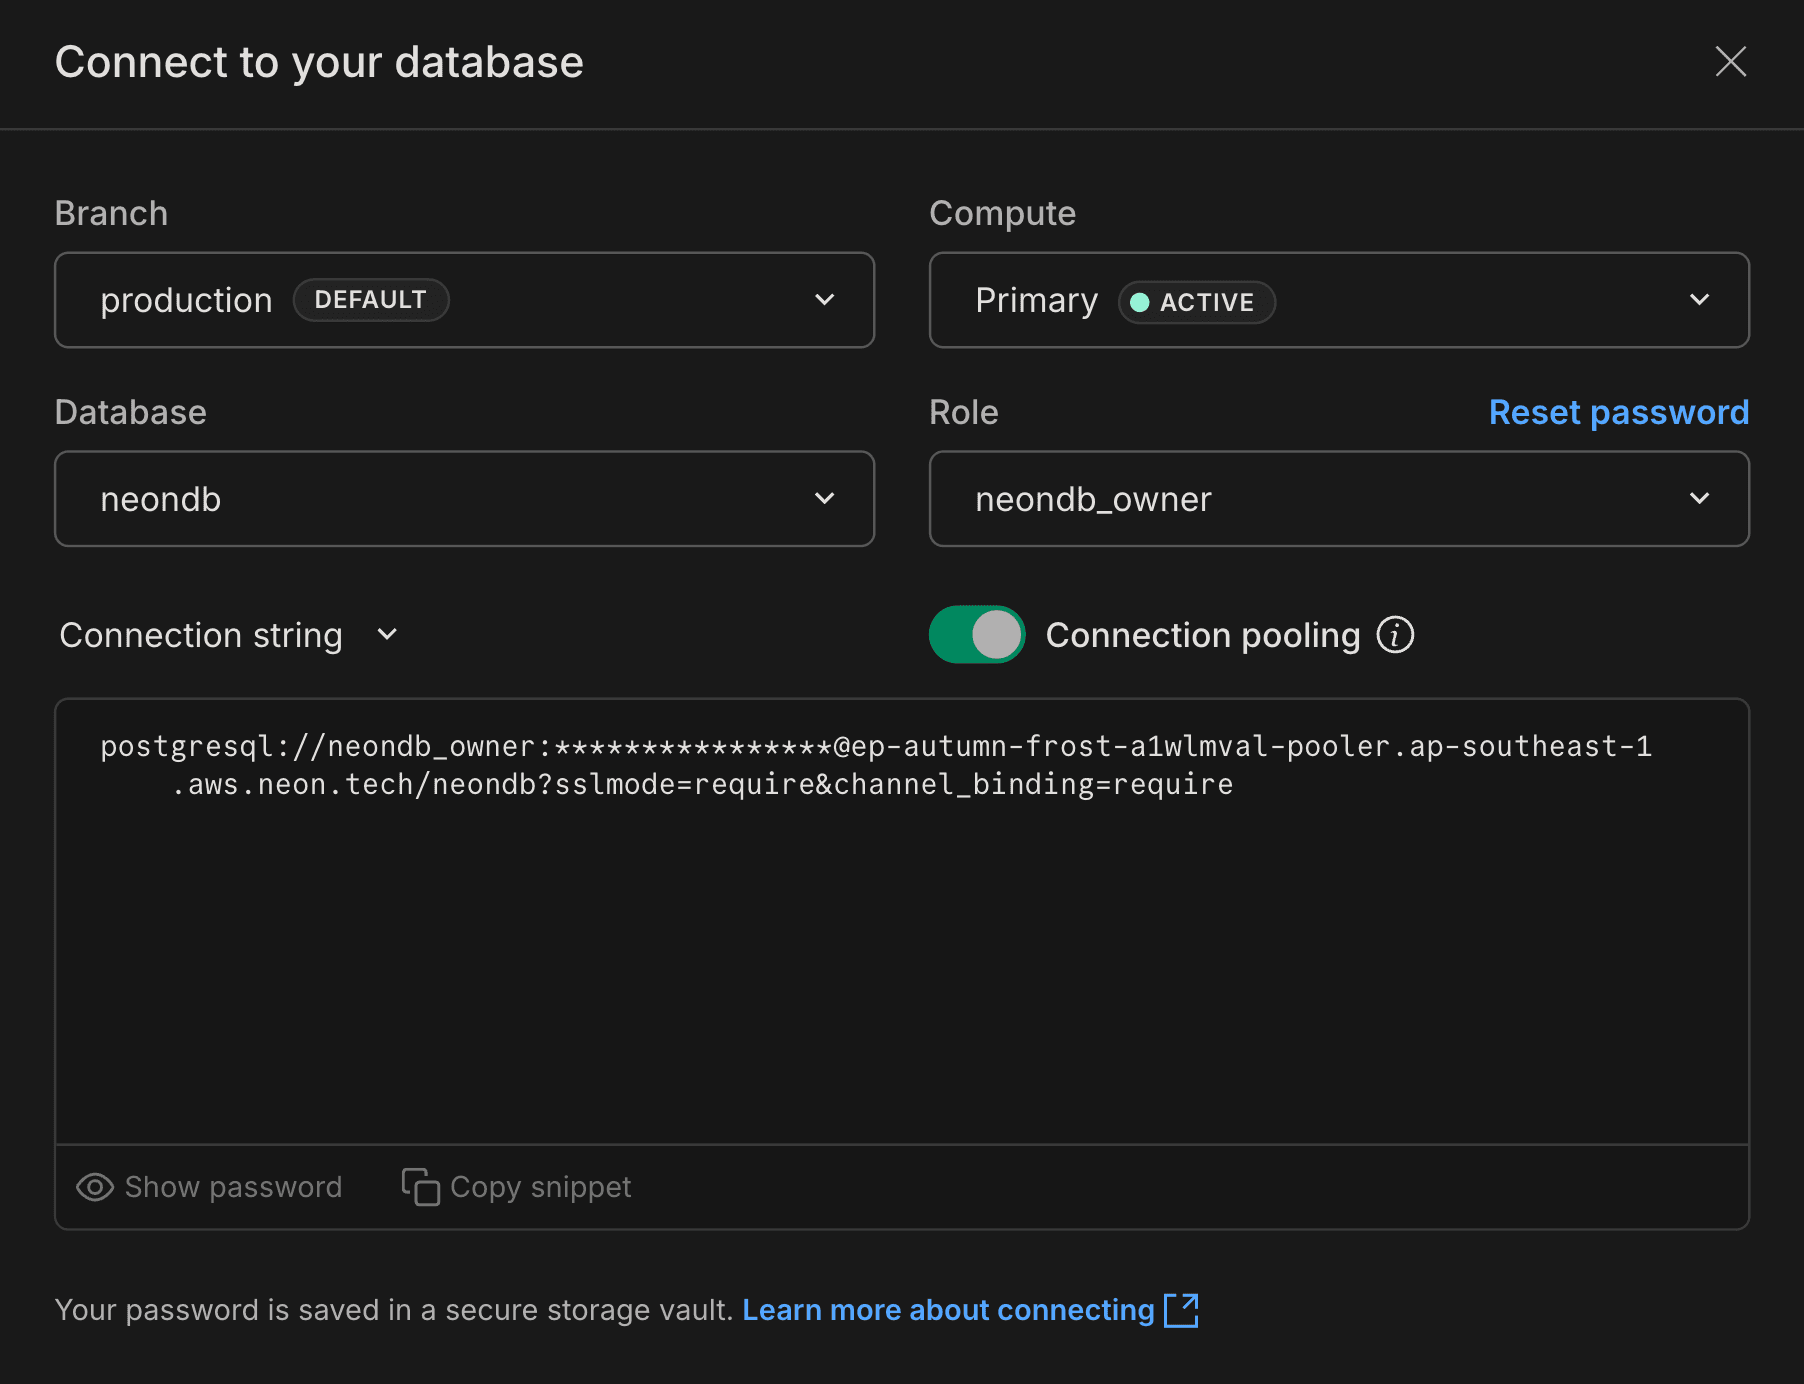
-
Make sure Use a secure connection (SSL) is enabled - Neon requires SSL by default.
-
-
Save the connection by clicking Connect database.
Option 2: Run Metabase Locally
You can also run Metabase locally with Docker:
-
Install Docker
Make sure you have Docker installed and running. -
Start the Metabase container
Open a terminal and run:docker run -d -p 3000:3000 \ --name metabase metabase/metabase -
Access Metabase: Open your browser and go to
http://localhost:3000. -
Complete the setup wizard
- Enter required details to create your admin account.
- When prompted to connect a database, select PostgreSQL and enter your Neon connection details as described in Option 1.
-
Save the connection by clicking Connect database.
Now that Metabase is connected to your Neon database, you can start loading data and building dashboards.
Loading sample data
In this guide, you'll load a sample e-commerce dataset into your Neon database to explore with Metabase.
Create sample tables
Connect to your Neon database using the Neon SQL Editor or any Postgres client of your choice, and run the following SQL commands to create the necessary tables:
-- Create customers table
CREATE TABLE customers (
    customer_id SERIAL PRIMARY KEY,
    customer_name VARCHAR(100) NOT NULL,
    email VARCHAR(255) UNIQUE,
    city VARCHAR(100),
    country VARCHAR(100),
    created_at TIMESTAMP WITH TIME ZONE DEFAULT CURRENT_TIMESTAMP
);

-- Create products table
CREATE TABLE products (
    product_id SERIAL PRIMARY KEY,
    product_name VARCHAR(200) NOT NULL,
    category VARCHAR(100),
    price DECIMAL(10, 2) NOT NULL,
    stock_quantity INT DEFAULT 0,
    created_at TIMESTAMP WITH TIME ZONE DEFAULT CURRENT_TIMESTAMP
);

-- Create orders table
CREATE TABLE orders (
    order_id SERIAL PRIMARY KEY,
    customer_id INT REFERENCES customers(customer_id),
    order_status VARCHAR(50) DEFAULT 'pending',
    total_amount DECIMAL(12, 2),
    order_date DATE DEFAULT CURRENT_DATE,
    created_at TIMESTAMP WITH TIME ZONE DEFAULT CURRENT_TIMESTAMP
);

-- Create order_items table
CREATE TABLE order_items (
    order_item_id SERIAL PRIMARY KEY,
    order_id INT REFERENCES orders(order_id),
    product_id INT REFERENCES products(product_id),
    quantity INT NOT NULL,
    unit_price DECIMAL(10, 2) NOT NULL,
    created_at TIMESTAMP WITH TIME ZONE DEFAULT CURRENT_TIMESTAMP
);
These commands will create four tables: customers, products, orders, and order_items to simulate a basic e-commerce schema.
Insert sample data
Next, populate the tables with sample records:
-- Insert sample customers
INSERT INTO customers (customer_name, email, city, country, created_at) VALUES
   ('Alice Johnson', 'alice@example.com', 'New York', 'USA', '2025-11-10'),
   ('Bob Smith', 'bob@example.com', 'London', 'UK', '2025-12-12'),
   ('Carol White', 'carol@example.com', 'Paris', 'France', '2025-12-15'),
   ('David Brown', 'david@example.com', 'Berlin', 'Germany', '2026-01-10'),
   ('Emma Davis', 'emma@example.com', 'Tokyo', 'Japan', '2026-01-12');

-- Insert sample products
INSERT INTO products (product_name, category, price, stock_quantity) VALUES
   ('Wireless Mouse', 'Electronics', 29.99, 150),
   ('Mechanical Keyboard', 'Electronics', 129.99, 75),
   ('USB-C Hub', 'Electronics', 49.99, 200),
   ('Monitor Stand', 'Furniture', 79.99, 50),
   ('Desk Lamp', 'Furniture', 34.99, 100),
   ('Webcam HD', 'Electronics', 89.99, 60),
   ('Headphones', 'Electronics', 149.99, 45),
   ('Standing Desk', 'Furniture', 599.99, 20);

-- Insert sample orders
INSERT INTO orders (customer_id, order_status, total_amount, order_date) VALUES
   (1, 'completed', 189.97, '2026-01-15'),
   (1, 'completed', 79.99, '2026-01-18'),
   (2, 'completed', 229.98, '2026-01-16'),
   (3, 'pending', 49.99, '2026-01-19'),
   (4, 'completed', 599.99, '2026-01-17'),
   (5, 'completed', 149.99, '2026-01-20'),
   (2, 'shipped', 89.99, '2026-01-21'),
   (1, 'completed', 34.99, '2026-01-22');

-- Insert sample order items
INSERT INTO order_items (order_id, product_id, quantity, unit_price) VALUES
   (1, 1, 2, 29.99),
   (1, 3, 2, 49.99),
   (2, 4, 1, 79.99),
   (3, 2, 1, 129.99),
   (3, 7, 1, 149.99),
   (4, 3, 1, 49.99),
   (5, 8, 1, 599.99),
   (6, 7, 1, 149.99),
   (7, 6, 1, 89.99),
   (8, 5, 1, 34.99);
This will insert data into each table to simulate customer orders and products.
Syncing the database schema in Metabase
Once the tables are created and populated:
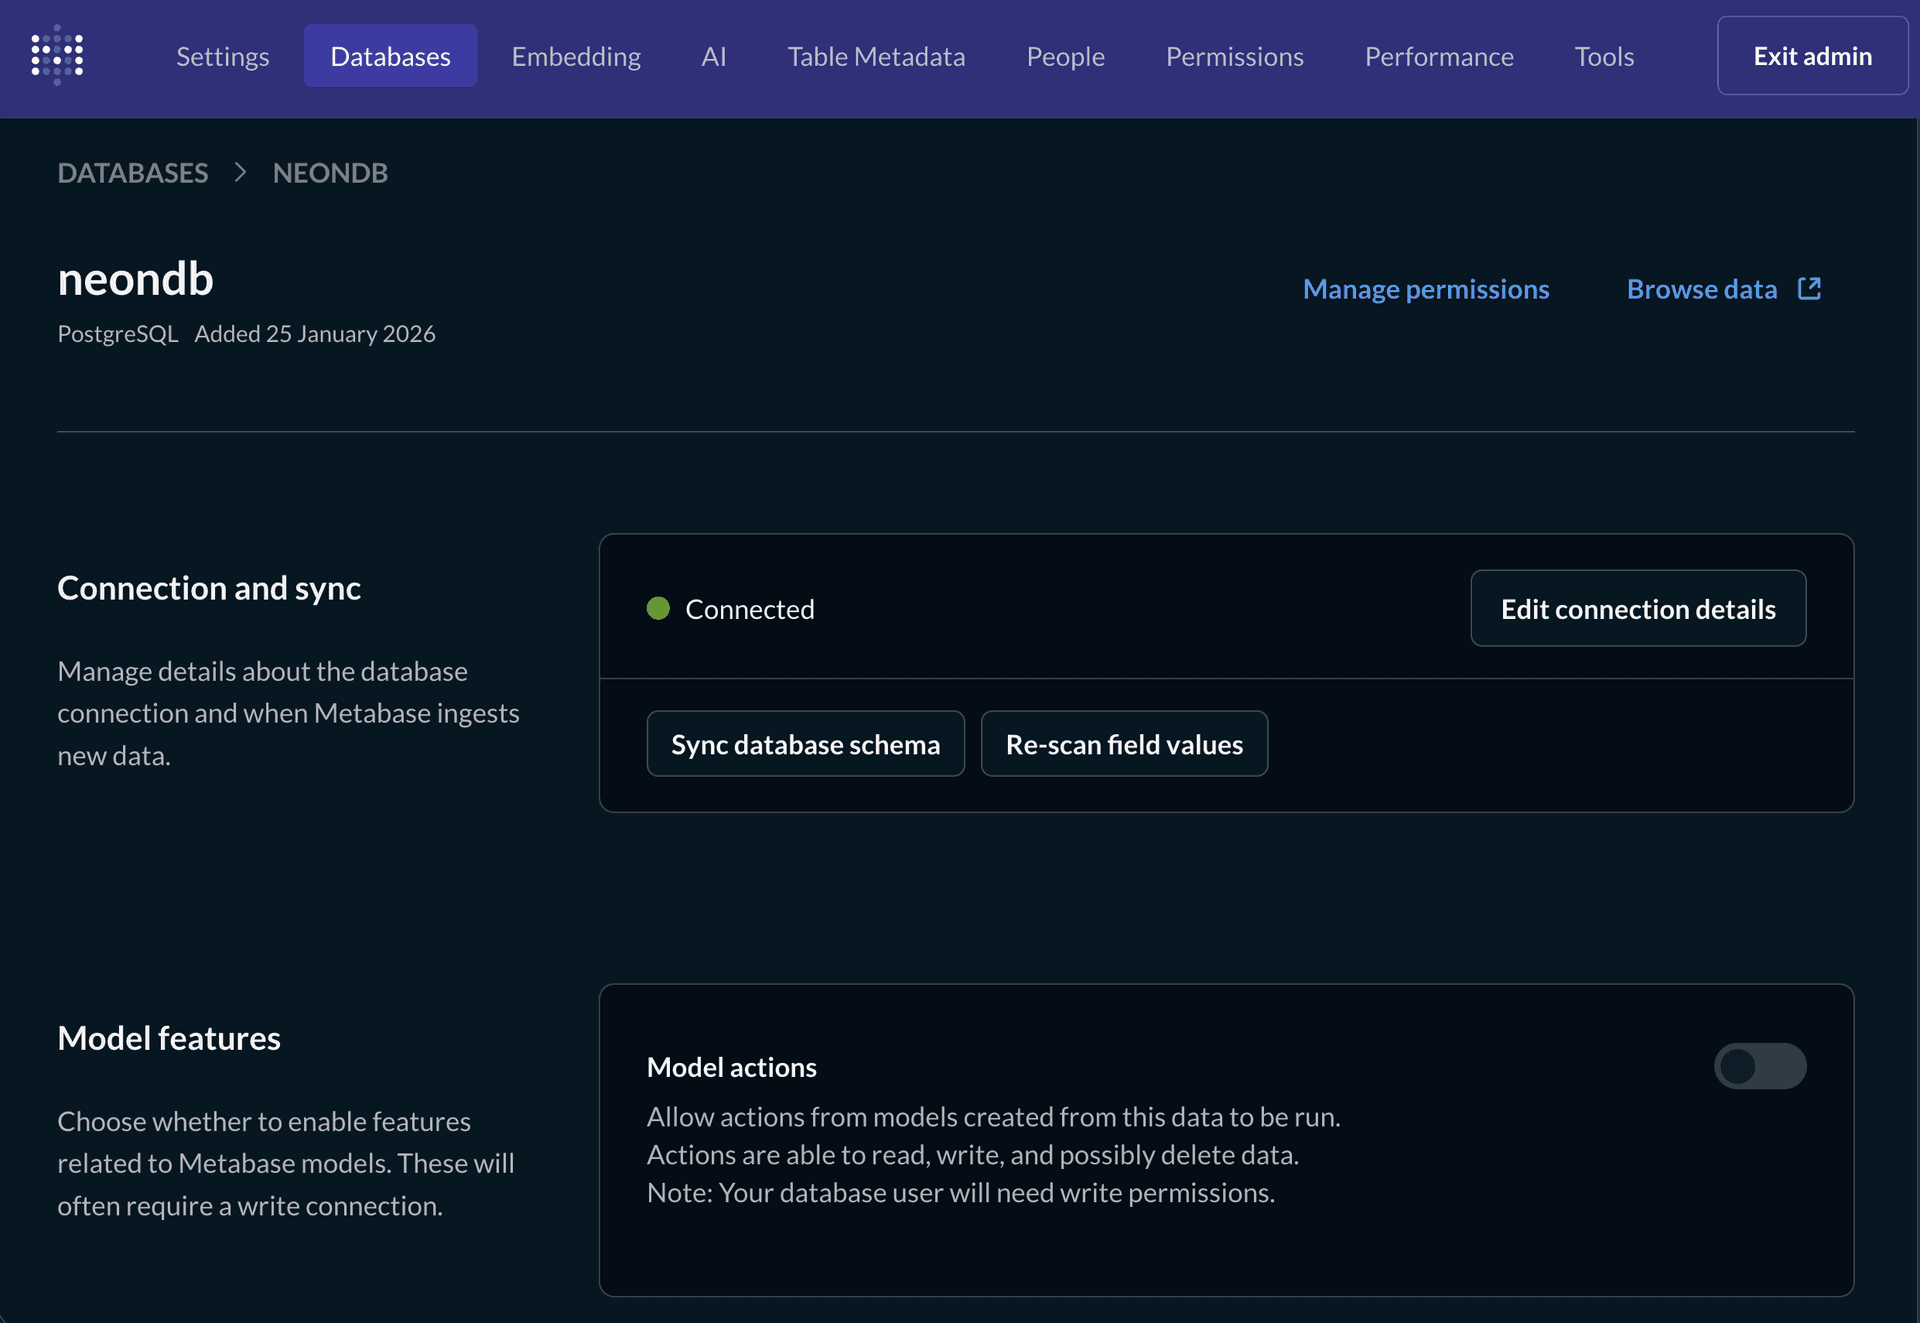
- In Metabase, navigate to Settings > Admin > Databases.
- Select your Neon database.
- Click Sync database schema to scan the schema and make the tables available in Metabase.
- Click Re-scan field values to collect metadata for improved querying and filtering.
Sync Frequency
Metabase automatically syncs your database schema on a regular schedule (1 hour by default). You can adjust the sync frequency in the database settings if needed. Learn more in the Metabase docs: Syncing and scanning databases.
Building Interactive Dashboards
With your data loaded and synced, you can start creating visualizations and dashboards.
Creating your First Question
In Metabase, Questions are saved queries that can be visualized and added to dashboards.
-
Click + New in the top navigation and choose Question.
-
Select your Neon database and the orders table.
-
Choose a starting point:
- Leave defaults to select all rows and columns.
- Use Filter to narrow results.
- Use Summarize to aggregate data.
-
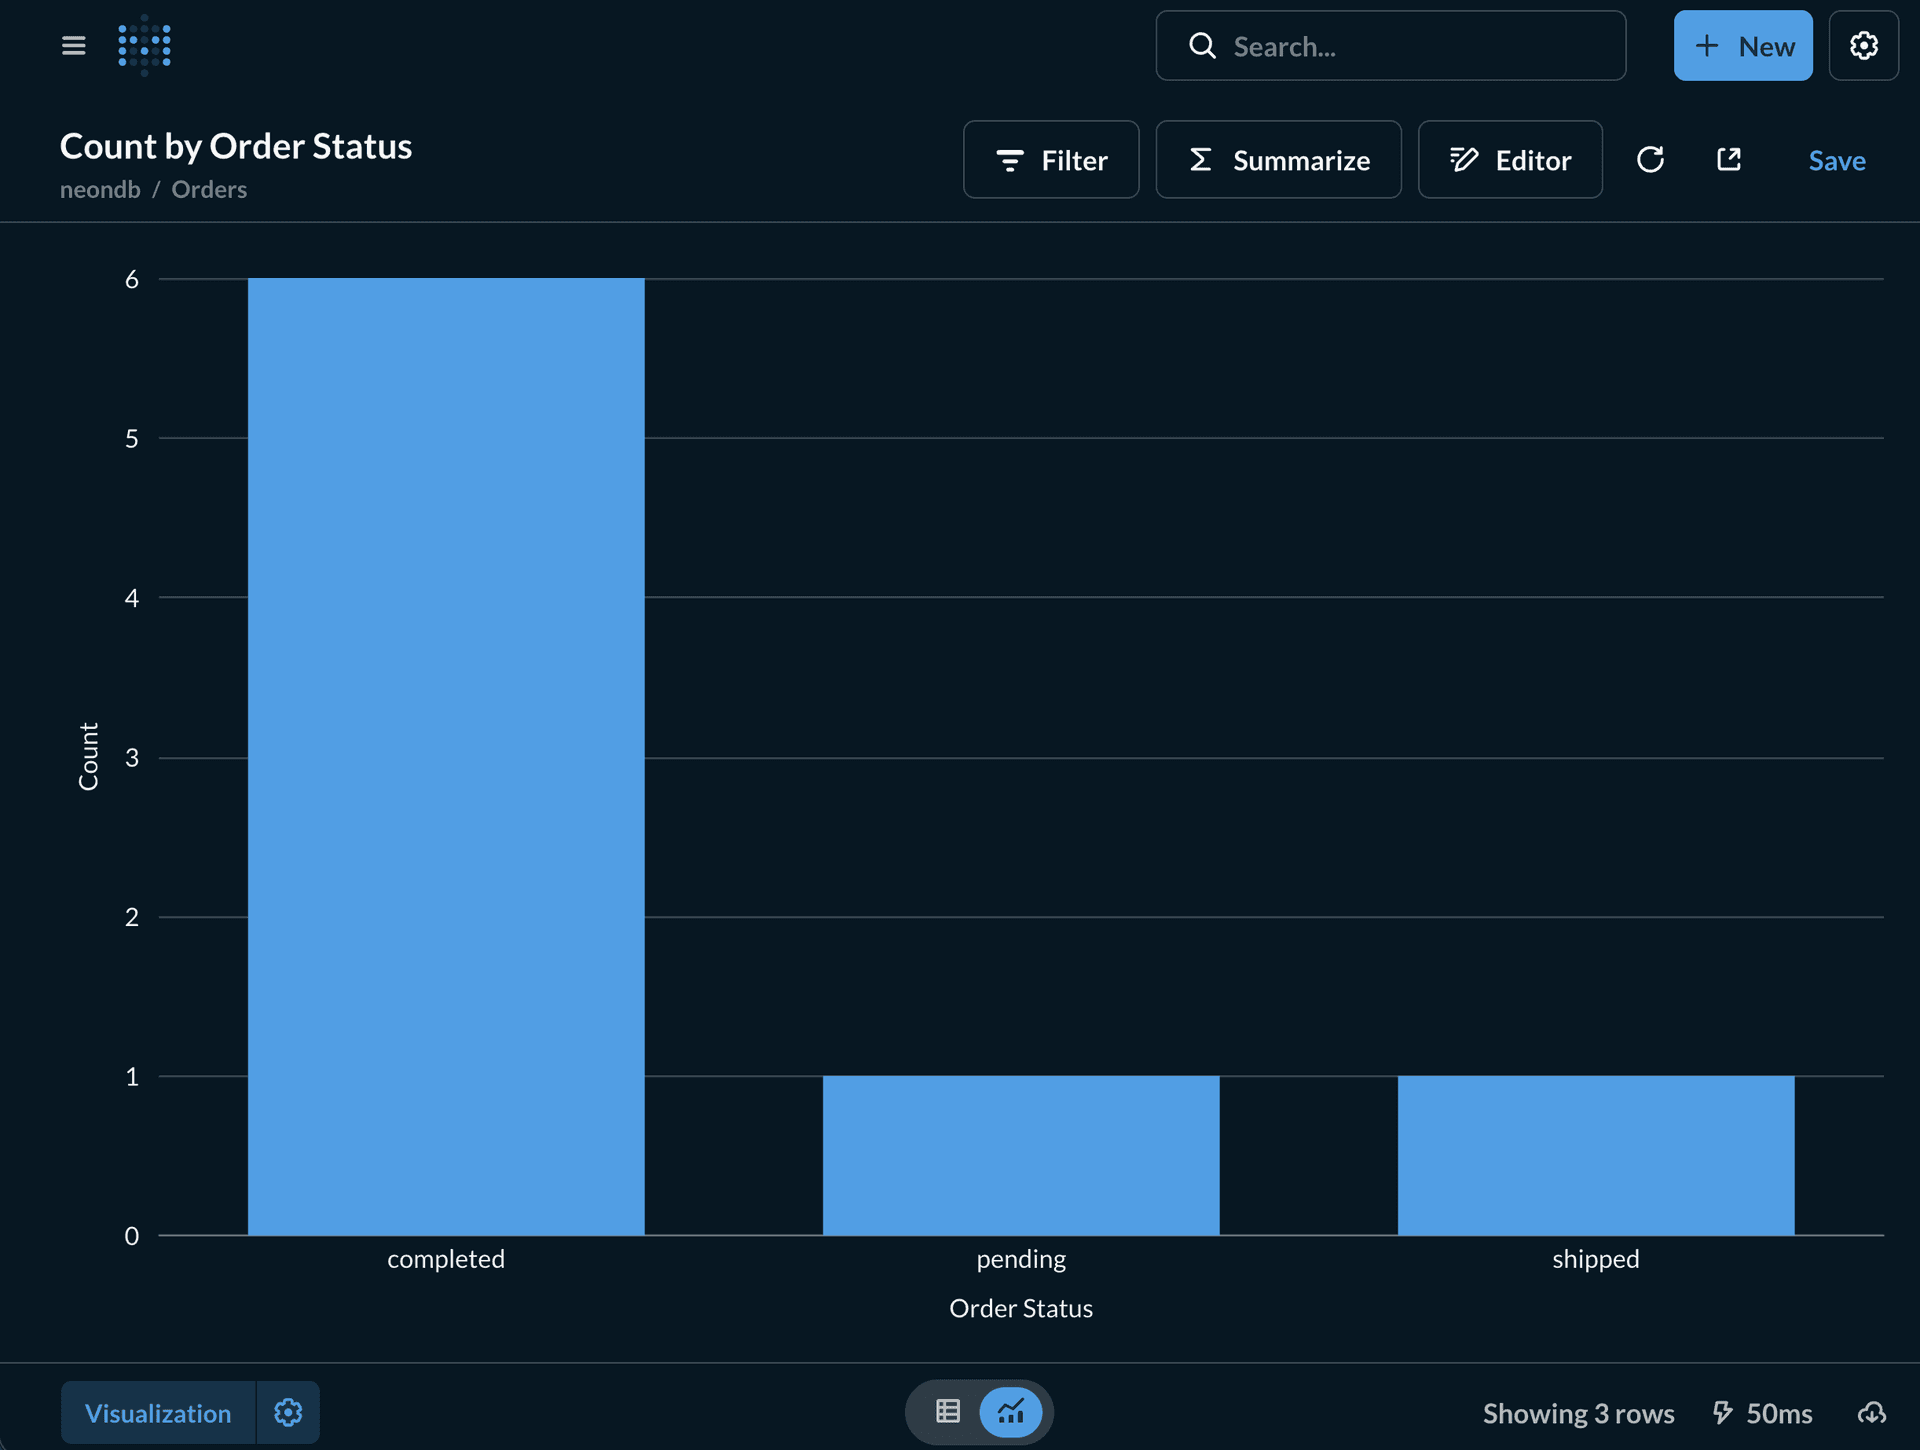
For your first question, create a summary of orders by status:
- Click Summarize and select Count of rows.
- Click Group by and choose Order Status.
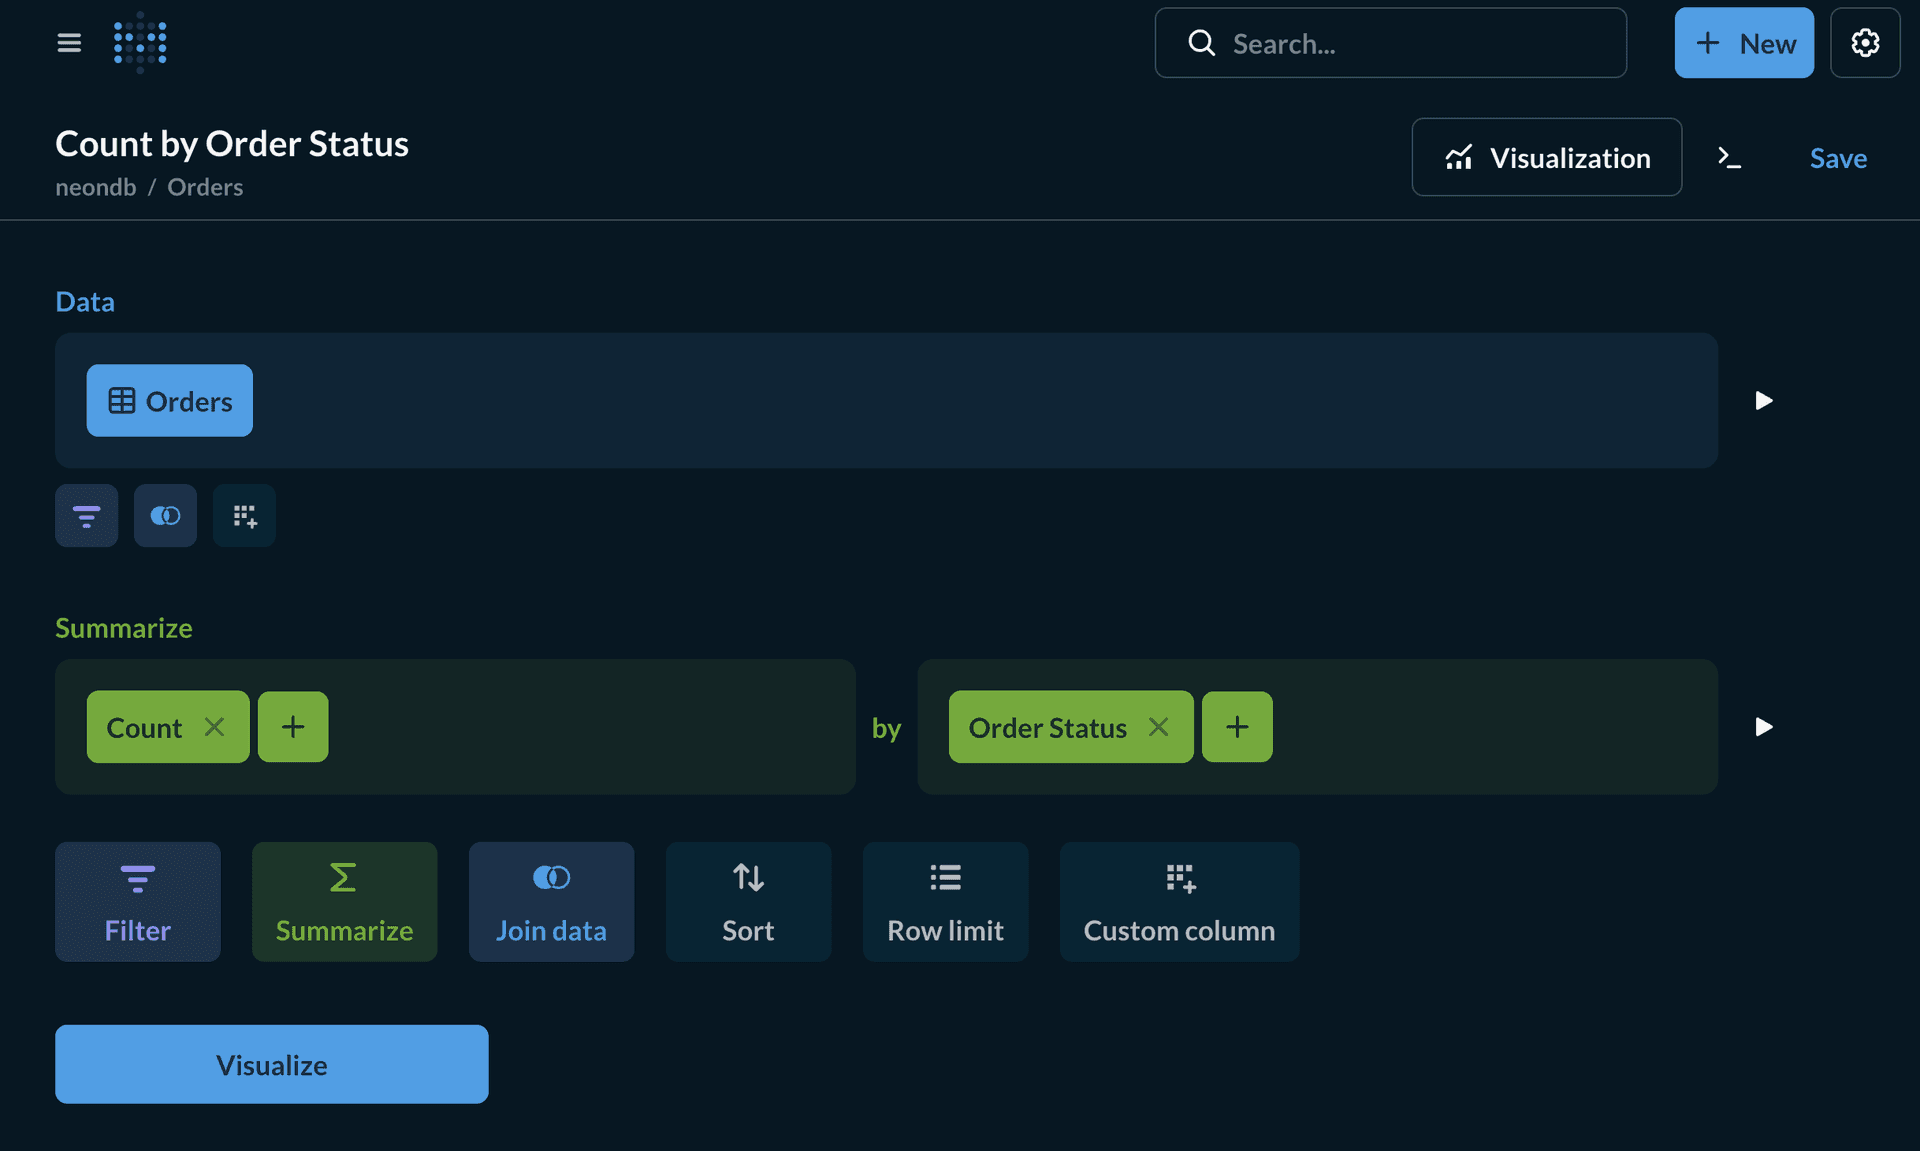
- Click Visualize to display the results as a bar chart.
-
Click Save and name the question Orders by Status.
Exploring SQL Queries
You can inspect the SQL that Metabase generates by clicking View SQL. This lets you see and understand the underlying query behind your visualization.
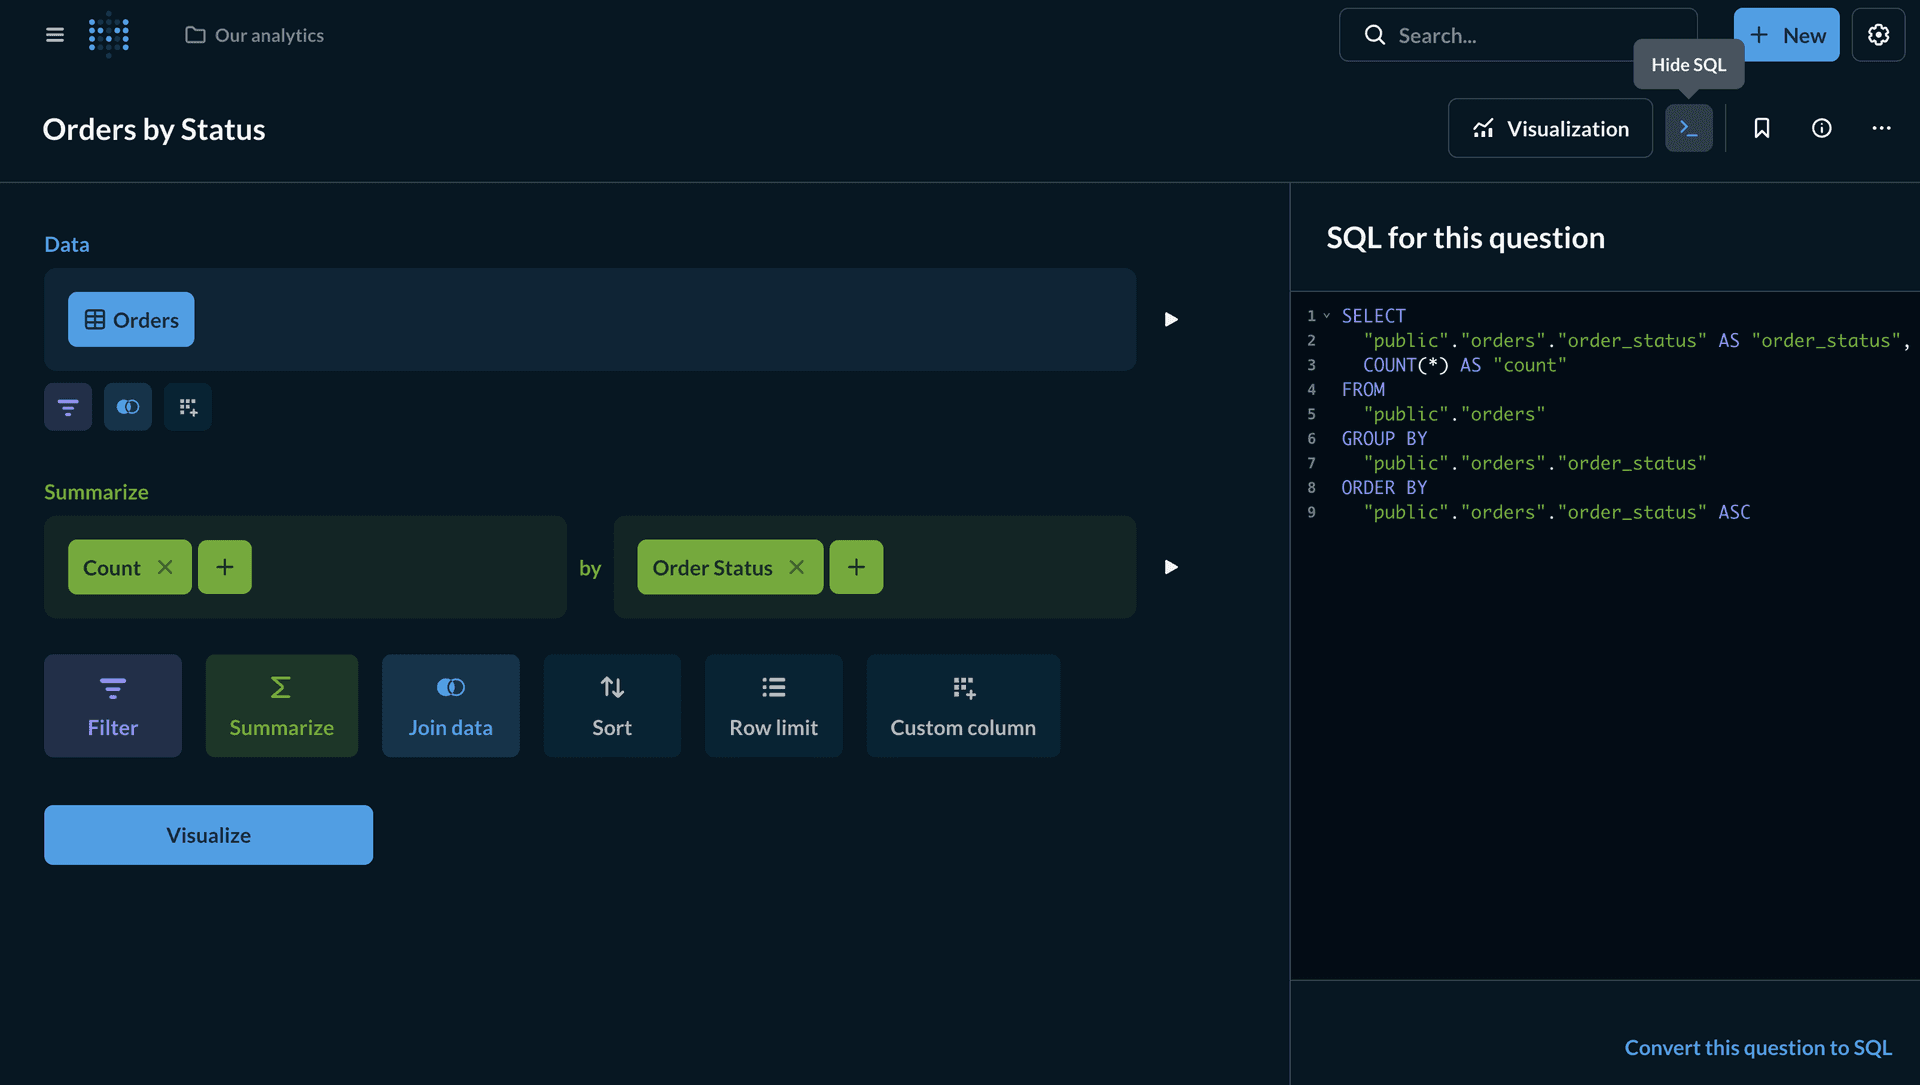
If you need more control, click Convert to SQL to switch into SQL mode and edit the query directly.
Building an Analytics Dashboard
Now, create a dashboard to combine multiple questions and visualizations.
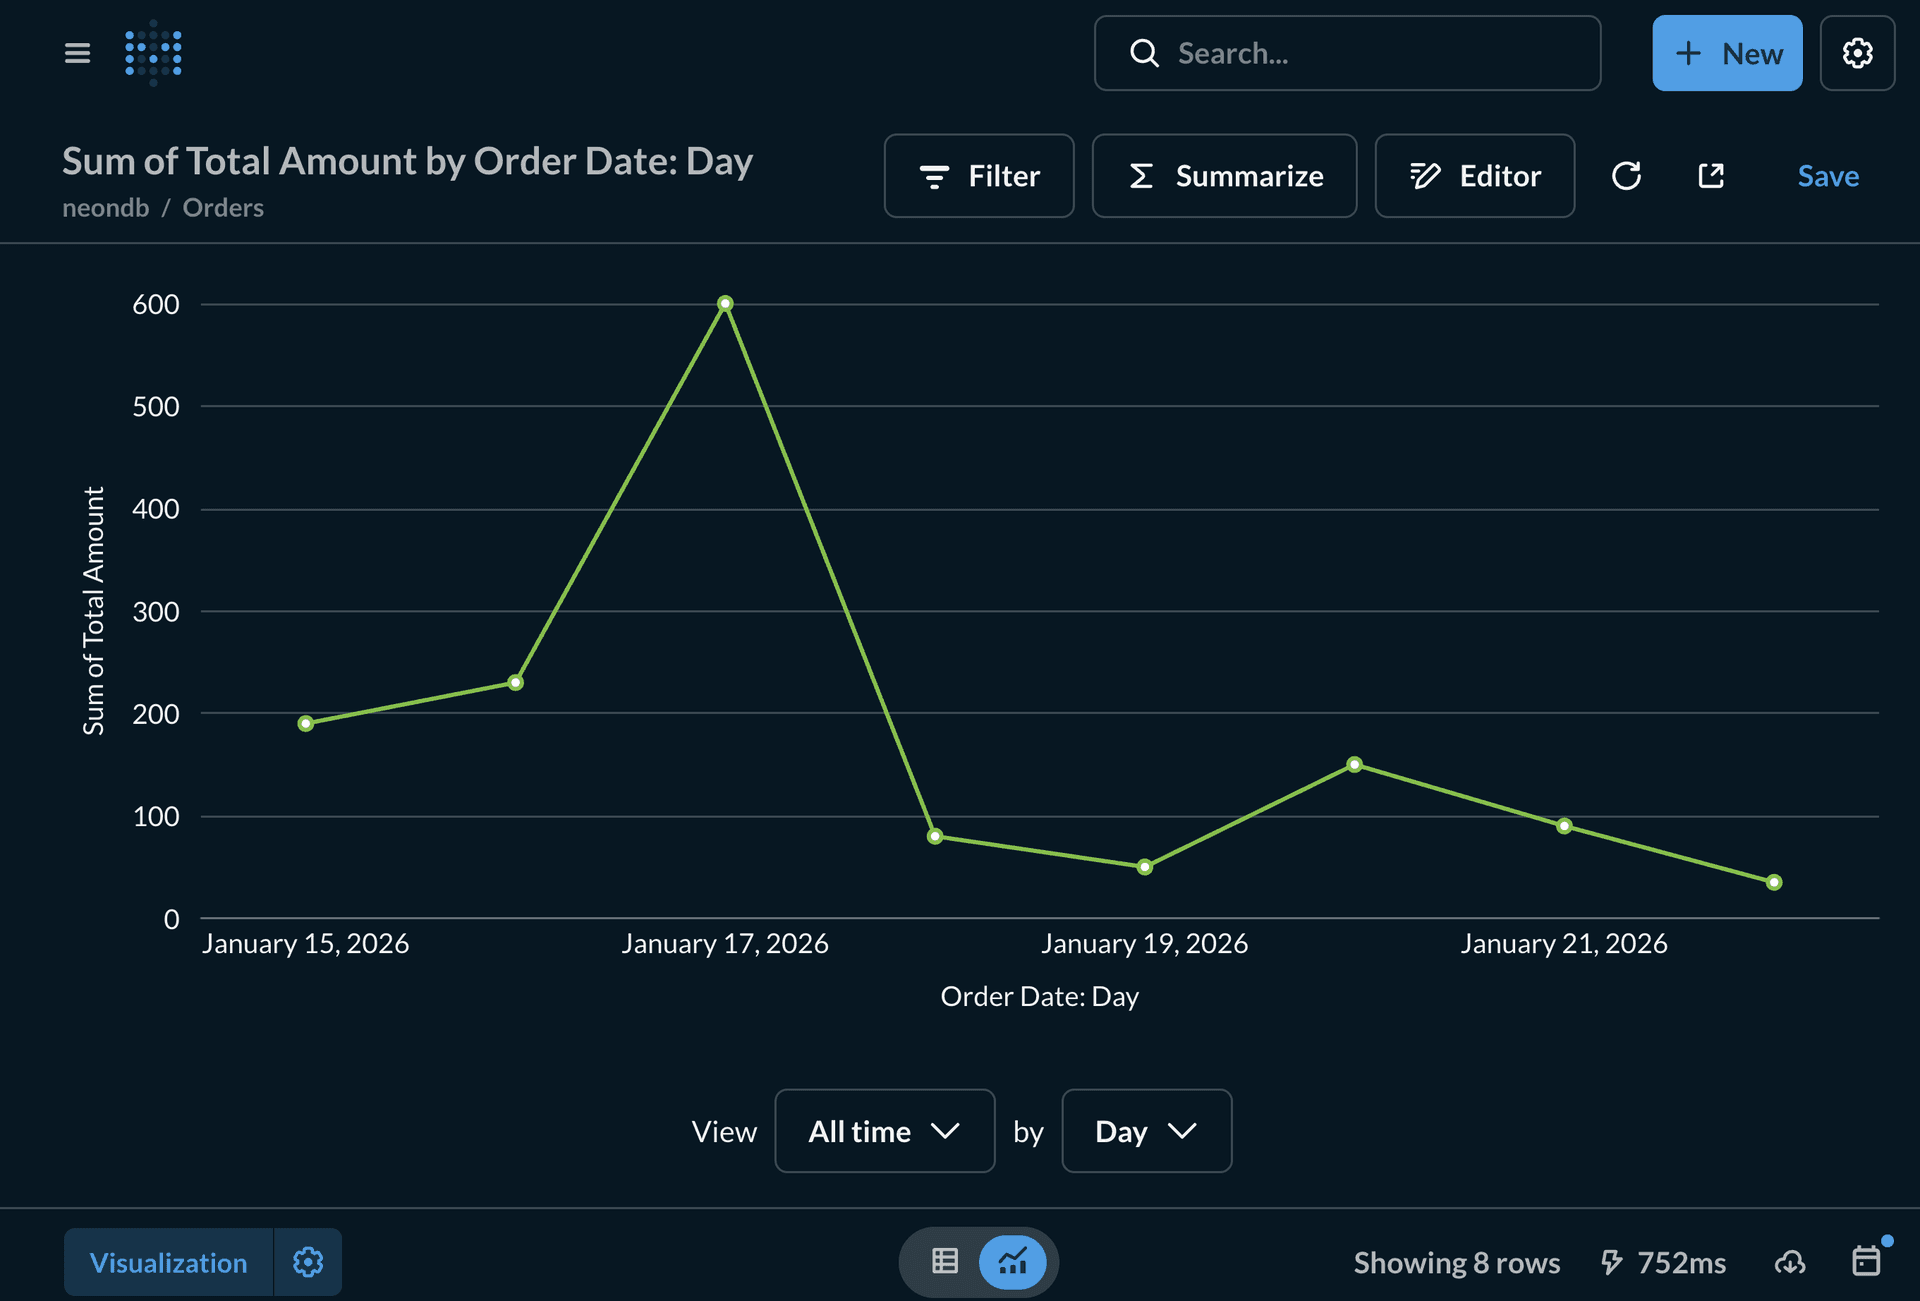
Question 1: Revenue over time
- Click + New > Question.
- Select your Neon database and the Orders table.
- Click Summarize:
- Choose Sum of Total Amount.
- Click Group by and select Order Date (by day or week).
- Click Visualize. A line chart will appear by default.
- Save the question as Revenue Over Time.
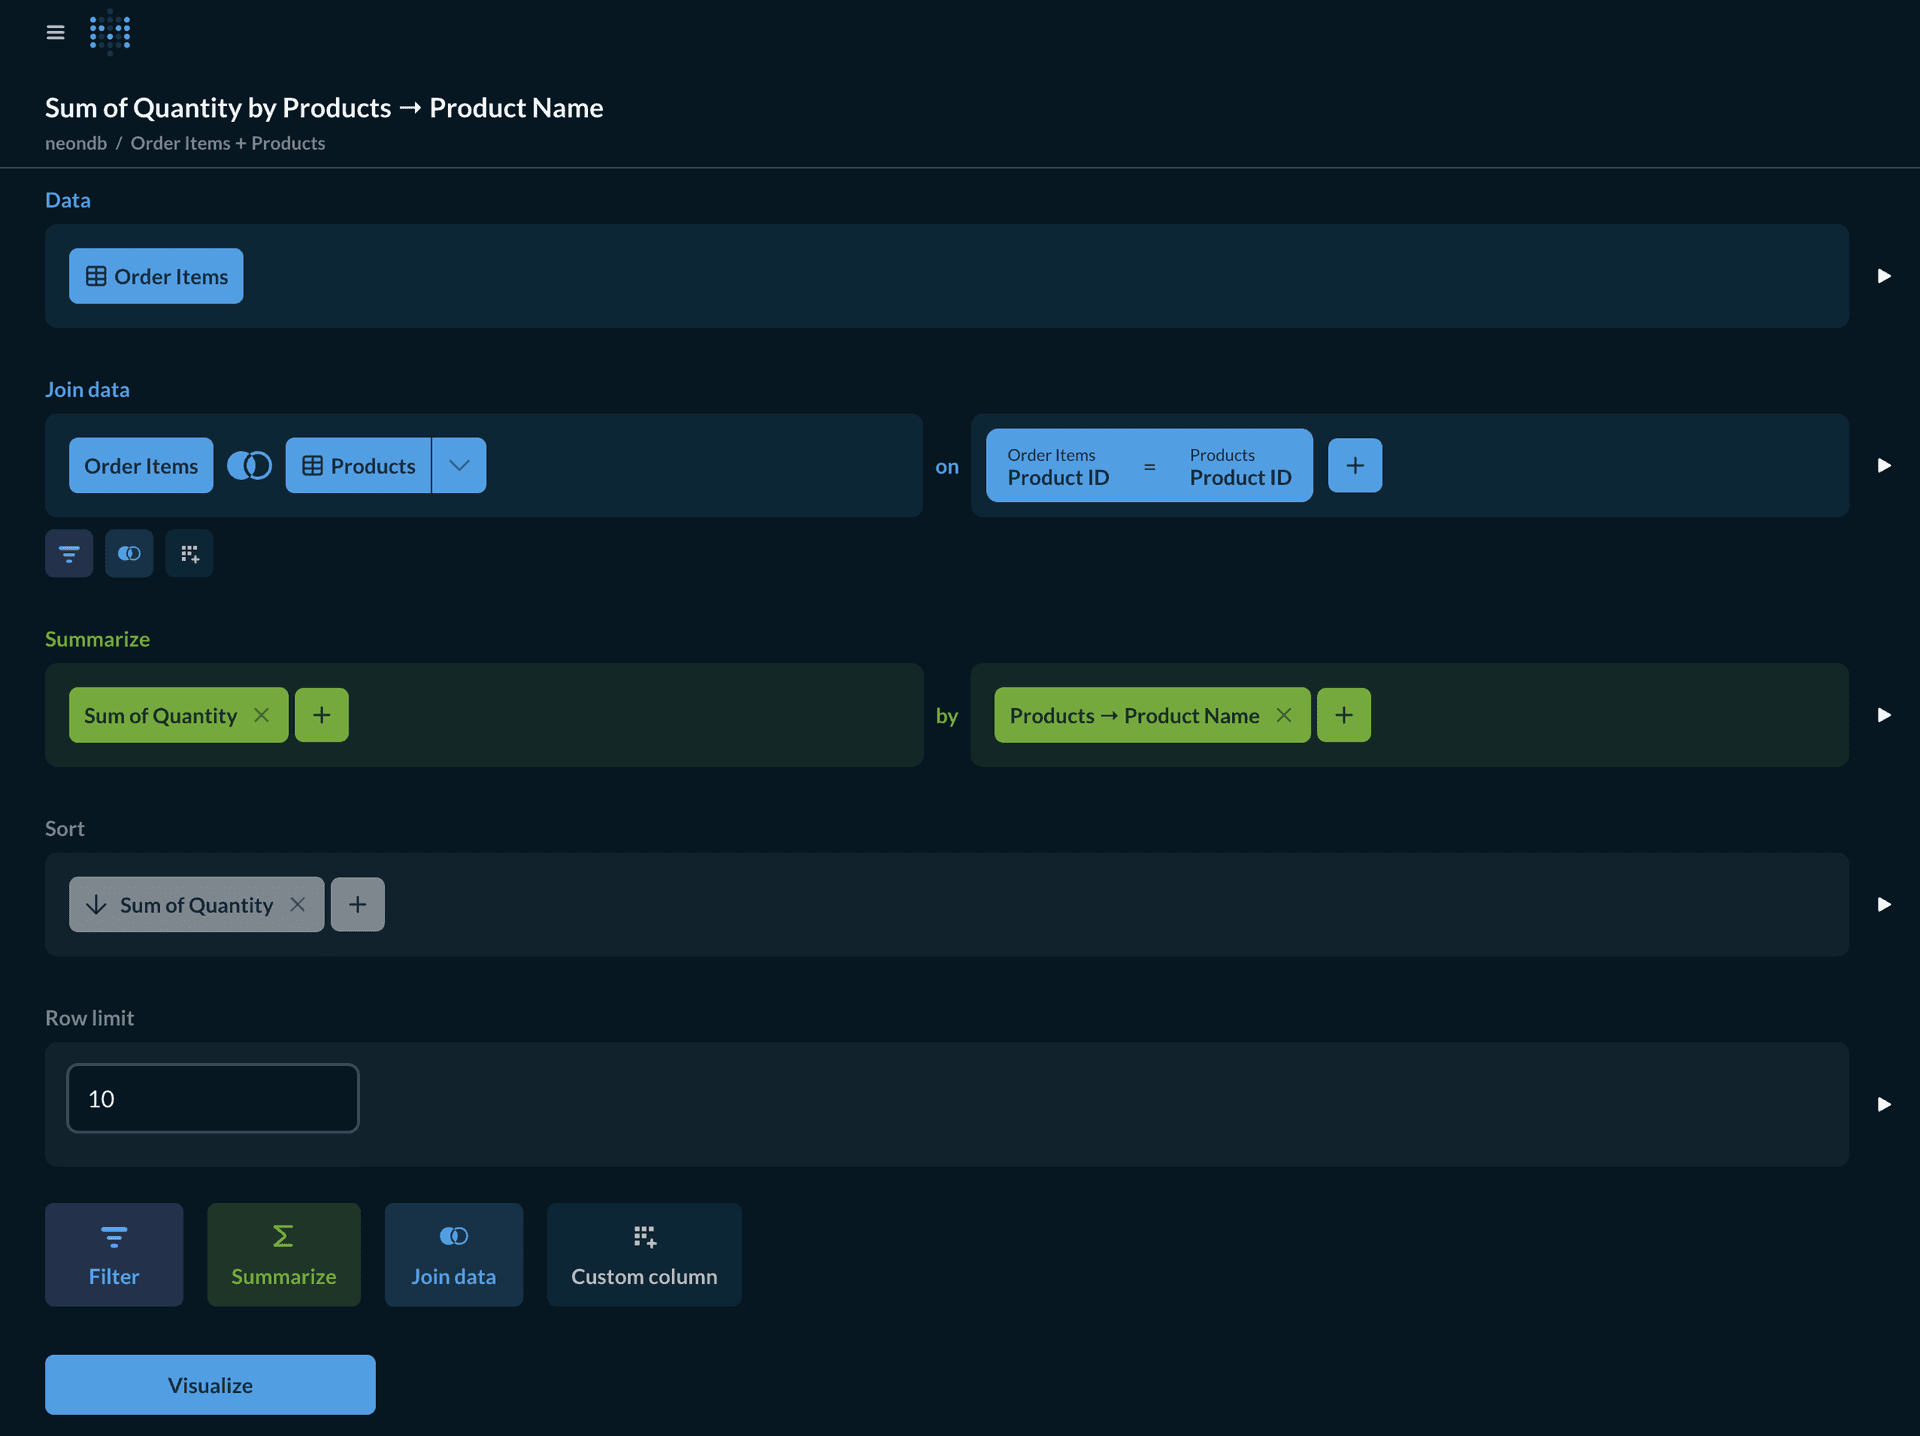
Question 2: Top selling products
-
Click + New > Question.
-
Select your Neon database and the Order Items table.
-
Join with the Products table:
- Open the Join data tab below the table selector.
- Add a join on Order Items → Product Id = Products → Product Id.
-
Click Summarize:
- Choose Sum of Order Items → Quantity.
- Click Group by and select Products → Product Name.
-
Set Sort to descending order by the sum of quantity.
-
Set the Rows limit to 10 to display the top 10 products.
-
Save the question as Top Selling Products.
Question 3: Customer acquisition by month
- Click + New > Question.
- Select your Neon database and the Customers table.
- Click Summarize:
- Choose Count of rows.
- Click Group by and select Created At by Month.
- Save the question as Customer Acquisition.
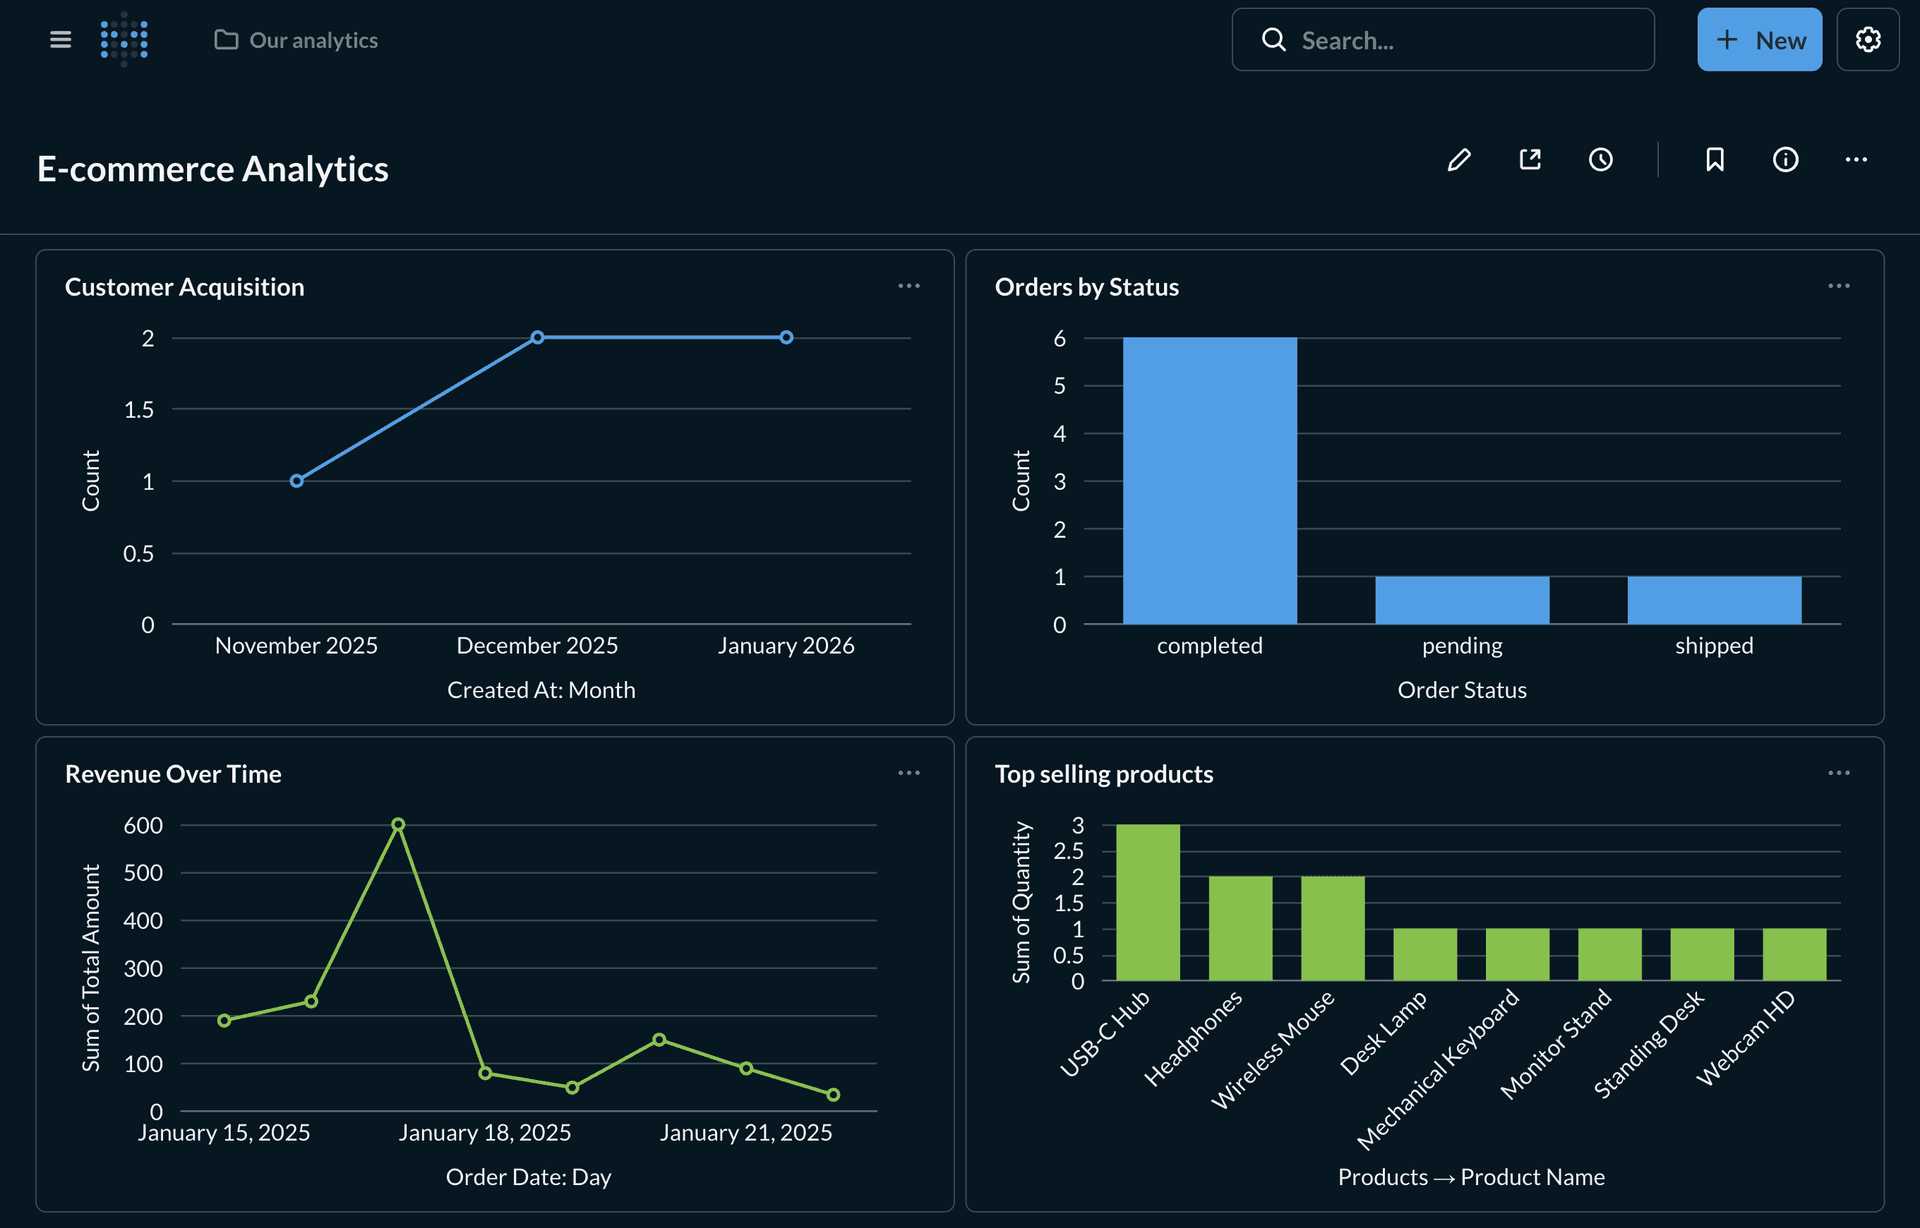
Creating the Dashboard
- Click + New > Dashboard.
- Name the dashboard E-commerce Analytics.
- Click the + icon to add questions:
- Add Revenue Over Time (line chart).
- Add Orders by Status (bar chart).
- Add Top Selling Products (bar chart).
- Add Customer Acquisition (line chart).
- Rearrange the cards by dragging them into your preferred layout.
- Click Save to create the dashboard.
Adding filters to dashboards
You can enhance dashboards with filters that apply across multiple questions:
- Click Edit on your dashboard.
- Click Filters in the top-right corner.
- Add a filter:
- Text/Category for text fields.
- Date for date fields.
- Number for numeric fields.
- Connect the filter to relevant questions:
- Click the gear icon on each card.
- Select the column to filter on.
- Click Save to apply the filter.
Applying Governance with Collections and Permissions
Metabase provides a robust permission system to control who can view, edit, or query your data. Governance is primarily managed through Groups.
Organizing People into Groups
Permissions are assigned to groups, not individual users.
- Go to Settings > Admin settings > People > Groups.
- Create groups that map to your organizational structure (e.g., Executive Team, Support, Data Analysts).
- Add users to these groups.
The 'All Users' Group
Every user is automatically a member of the "All Users" group. To enforce strict governance, it is best practice to set "All Users" permissions to No access (for collections) and Blocked (for databases), and then granularly grant permissions to specific groups.
Once groups are set up, you can define permissions at two levels: Collections and Databases (Data Permissions).
Controlling Content with Collections
Collections organize questions, dashboards, and models. You can control access levels for each group per collection.
- Go to Admin settings > Permissions > Collections.
- Select a group (e.g., Support).
- Set the permission level for a specific collection (e.g., E-commerce Analytics):
- View access: Can see the dashboard and questions but cannot edit them.
- Curate access: Can edit, move, or archive items in the collection.
- No access: The collection and its contents are hidden.
Requires Metabase Pro or Enterprise
Advanced data permissions - including Row and Column Security, User Attributes, and granular View Data settings are available only in Metabase Pro and Enterprise editions. If you are using the free or open-source version, these options will not be visible in your Admin settings.
Controlling Database Access (Data Permissions)
Data permissions control how users interact with the raw data in your Neon database.
-
Go to Admin settings > Permissions > Data.
-
Select a group and your Neon database.
-
Configure the two main permission types:
View Data: Determines how much of the database the group can see.
- Can view: Full access to all tables and rows.
- Granular: Allows you to restrict access to specific schemas or tables.
- Blocked: The group cannot see this database or its metadata.
- Row and Column Security: Restricts access based on user attributes.
Create queries: Determines how the group can ask questions.
- Query builder and native: Users can use the visual builder and write raw SQL.
- Query builder only: Users can use the visual builder but cannot write raw SQL. This is recommended for non-technical users to prevent expensive queries or accidental data exposure.
- No: Users cannot create new queries.
Advanced Governance (Row-Level Security)
For multi-tenant applications or strict data controls, you can restrict which rows a user sees based on their attributes (like customer_id or department). Metabase offers two ways to handle this with Neon.
Option A: Metabase Row and Column Security
Best for: Managing restrictions entirely within Metabase.
- Add User Attributes: In Admin settings > People, add an attribute to your users (e.g.,
country=USA). - Configure Permissions:
- Go to Permissions > Data and select a group.
- Change View Data to Row and Column Security.
- Select the table (e.g.,
customers). - Choose Filter by a column on this table.
- Map the table column (
country) to the User Attribute (country).
Now, when a user in this group views the customers table (or charts based on it), Metabase automatically adds a filter (e.g., WHERE country = 'USA').
Option B: Connection Impersonation
Best for: Leveraging PostgreSQL Row-Level Security (RLS) defined in Neon.
Since Neon is built on Postgres, you can define RLS policies directly in your database and force Metabase to respect them.
- In Neon: Create Postgres roles (e.g.,
manager_role,analyst_role) and define RLS policies. - In Metabase:
- Add a User Attribute to your users that matches the Postgres role name (e.g.,
db_role=manager_role). - In Permissions > Data, set View Data to Impersonation.
- Select the User Attribute (
db_role) to use for the connection.
- Add a User Attribute to your users that matches the Postgres role name (e.g.,
When a user runs a query, Metabase connects to Neon and sets the Postgres role to the value in their attribute. Neon then applies the underlying RLS policies, ensuring the user only sees permitted data.
Scaling your Analytics
As your data volume grows and analytics workloads increase, you can use Neon's scaling features to maintain performance and reliability.
Connection Pooling
Metabase opens multiple connections to your database when running concurrent queries. Without pooling, you may quickly hit connection limits.
Ensure you enable Connection pooling in the Neon Console (Connect modal) and use the provided pooled host and port when configuring Metabase. This ensures efficient connection management and prevents resource exhaustion.
Read replicas for Analytics
For heavy analytics workloads, create a read replica to offload queries from your primary database. Point Metabase to the read replica so analytics queries do not interfere with transactional operations. As a security best practice, consider connecting Metabase with a read-only user or using read replicas to ensure analytics queries cannot modify production data.
Learn more in the Neon Read Replicas guide. Optionally, disable scale to zero on the read replica to keep it always available for analytics.
Query performance optimization
Beyond infrastructure scaling, optimize your schema and queries for analytics:
-
Add indexes on frequently filtered or joined columns:
CREATE INDEX idx_orders_customer_id ON orders(customer_id); CREATE INDEX idx_orders_order_date ON orders(order_date); CREATE INDEX idx_order_items_product_id ON order_items(product_id); CREATE INDEX idx_order_items_order_id ON order_items(order_id); -
Use materialized views for complex, frequently-run aggregations:
CREATE MATERIALIZED VIEW daily_revenue AS SELECT order_date, SUM(total_amount) AS daily_revenue, COUNT(*) AS order_count FROM orders WHERE order_status = 'completed' GROUP BY order_date ORDER BY order_date; -- Refresh periodically REFRESH MATERIALIZED VIEW daily_revenue; -
Partition large tables (e.g., by date) to improve query efficiency and maintenance.
Moving to Production (Self-Hosted Metabase)
By default, self-hosted Metabase uses an internal H2 database to store its application data (users, settings, saved questions, dashboards). The H2 database is not suitable for production environments.
To run Metabase in production, configure it to use Neon as the backing database:
-
Create a separate database in Neon (e.g.,
metabaseappdb) to store Metabase’s internal data. -
Run Metabase with Neon Postgres by starting the container with the following command:
docker run -d -p 3000:3000 \
  -e "MB_DB_TYPE=postgres" \
  -e "MB_DB_DBNAME=metabaseappdb" \
  -e "MB_DB_PORT=5432" \
  -e "MB_DB_USER=name" \
  -e "MB_DB_PASS=password" \
  -e "MB_DB_HOST=my-database-host" \
  --name metabase metabase/metabase
Replace
name,password, andmy-database-hostwith your Neon database credentials and host.
This configuration ensures Metabase uses Neon Postgres for its application database, making your deployment production-ready.
Conclusion
You have successfully connected Metabase to Neon, loaded sample data, built interactive dashboards, and learned how to govern access and scale your analytics infrastructure. This setup provides a solid foundation for business intelligence and data exploration.
Metabase's intuitive interface allows business users to explore data without SQL knowledge, while the combination of Neon's connection pooling and read replicas ensures your analytics workloads don't impact production performance.
Resources
Need help?
Join our Discord Server to ask questions or see what others are doing with Neon. For paid plan support options, see Support.